

How to Use AI Heatmaps to Find UX Problems in Your Product
Want to create apps users actually love? Learn how AI-powered heatmaps find UX problems you can't spot. Real guide to fix user flows before they hurt your product.


Hi there, tech leaders,
User behavior can make or break a product. But most teams track basic metrics like page views and bounce rates, missing deeper insights about how users actually interact with their apps.
Let's look at practical ways to use AI-powered heatmaps and click patterns to build better products.
The Problem with Traditional UX Analysis
Traditional analytics provide you with aggregate data: you might know that users are dropping off during onboarding, but you won’t see which interface elements cause confusion or frustration. Conventional tools simply report “what” happened without clarifying the underlying reasons. This gap in insight can leave you guessing about the exact pain points in your user interface.
AI-driven heatmaps address this shortfall by visualizing every user interaction in real time. They don’t just tell you that users aren’t clicking the “Submit” button—they show you if users are hovering around it, clicking on other, non-clickable elements, or even “rage clicking” in frustration. In doing so, AI helps you understand both the patterns and anomalies of user behavior, paving the way for targeted improvements.
Setting Up AI Heatmap Analysis
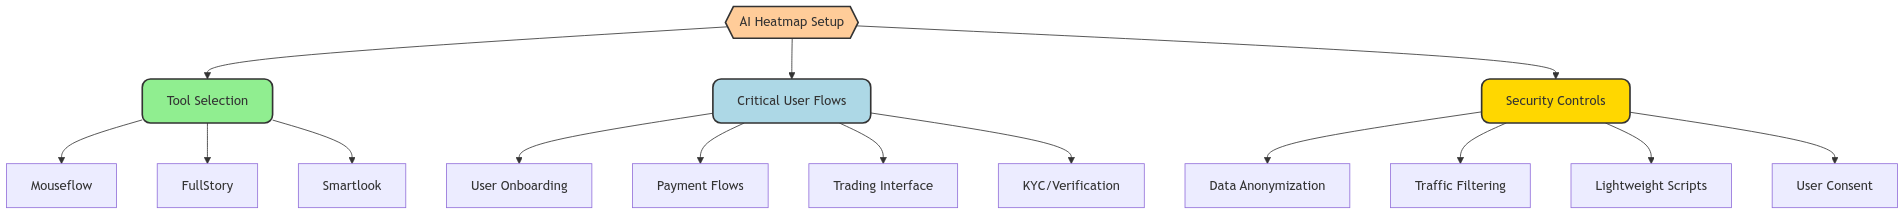
1. Pick the Right Tool for Your Stack
Not all heatmap tools work well for every UX. You need one that:
Handles secure data properly
Works with dynamic content and SPAs
Processes data in real-time
Scales with your user base
Good options include:
Mouseflow - Great for complex dashboards
FullStory - Strong in session replay and error tracking
Smartlook - Works well with React and Angular apps
2. Start with Critical User Flows
Before diving into full-scale data collection, narrow your focus to the most important parts of your app. Concentrate on areas that directly impact user conversion and satisfaction, such as:
User onboarding
Payment flows
Trading interfaces
Account settings
KYC/verification steps
This focused approach helps you:
Get clean data about important features
Find issues faster
Make improvements that matter
Save on processing resources
By targeting these key flows, you obtain high-quality, relevant data without overwhelming your system with extraneous information. This focused approach not only helps in quicker diagnosis of issues but also saves on processing resources and reduces noise in your data.
3. Set Up Data Collection Right
One of the biggest challenges in implementing AI-driven heatmaps is ensuring that data collection is both efficient and secure.
Common setup mistakes to avoid:
Tracking sensitive data
Collecting PII without proper consent
Using heavy scripts that slow down your app
Not filtering out internal traffic
Instead:
Use lightweight collectors
Anonymize user data
Set up proper data exclusions
Test impact on app performance
A practical implementation might involve embedding a small JavaScript snippet that tracks clicks, hovers, and scroll events, and then sends this data via asynchronous API calls to your secure backend. For instance, using a lightweight open-source library like heatmap.js can be an effective starting point. The key is to anonymize the data and optimize the code to ensure it does not affect your app’s performance.
Making Sense of Heatmap Data

Finding Real Problems
Once data is collected, the next step is to analyze it for actionable insights. AI can help sift through large volumes of data to detect patterns that might otherwise go unnoticed. For example, you might observe:
Rage Clicks: Multiple rapid clicks on non-interactive elements, which can indicate user frustration.
Dead Clicks: Instances where users click on elements that should be interactive but aren’t, suggesting a design flaw.
Hover Patterns: Prolonged hovering over certain UI areas, hinting at possible confusion or interest.
Scroll Drop-Offs: Points where users consistently stop scrolling, which might signal poorly placed content or unclear call-to-action sections.
AI models can cluster these behaviors, predict where users are likely to encounter difficulties, and even suggest UI modifications. For example, by applying machine learning techniques such as clustering or anomaly detection, you can automatically flag regions of your interface that deviate from expected user behavior.
Using AI to Spot Issues
Many AI-driven tools now go a step further by providing predictive insights. They don’t just display a heatmap; they analyze user interactions to forecast potential usability issues before they become widespread. For instance, if your model identifies an emerging pattern of drop-offs during a specific part of the onboarding process, you can proactively adjust the UI, test the changes, and prevent further user attrition.
Modern heatmap tools use AI to:
Detect unusual interaction patterns
Group similar user behaviors
Predict potential UX problems
Suggest UI improvements
This helps you fix issues before they affect many users.
Making Smart UX Changes
Quick Wins
The true power of AI-powered analysis is realized when you convert insights into concrete UX improvements. Here’s a practical roadmap:
Reposition Key Elements: If data shows that users are missing critical buttons or forms, consider repositioning these elements to more visible areas.
Streamline Navigation: Use click pattern data to identify confusing navigation paths and simplify them.
Enhance Feedback Mechanisms: Where users seem to hesitate or click repeatedly, add clearer feedback (like loading indicators or error messages) to guide them.
Eliminate Distractions: Remove or redesign elements that consistently draw attention away from primary tasks.
When you spot problems:
Move key elements into high-attention areas
Fix confusing navigation paths
Add missing feedback on actions
Remove distracting elements
Make clickable items obvious
Testing Changes
Before rolling out major changes across your entire platform, run A/B tests to compare the performance of your new design against the current one. This approach allows you to validate improvements with a subset of users and refine adjustments based on real-world performance metrics. Monitor key indicators such as completion rates, error frequency, and overall user satisfaction. Remember, the goal is not to achieve a “perfect” design from day one but to create a better experience through continuous improvement.
Before big updates:
Run A/B tests on major changes
Test with a small user segment first
Monitor key metrics like completion rates
Collect user feedback directly
Practical Tips for Better Results
Focus on User Segments
Split data by user type (retail vs. institutional)
Look at new vs. returning users
Compare mobile and desktop behavior
Study different market conditions
Track the Right Metrics
Time to complete key actions
Error rates in critical flows
Drop-off points
Return visitor patterns
Customer support triggers
Keep Security First
Use GDPR-compliant tools
Mask sensitive data
Follow regulations
Get proper user consent
Audit data collection regularly
Making It Work Long-Term

Don’t be afraid to experiment with more advanced AI techniques. For example, consider implementing a feedback loop where your system continuously learns from user behavior. Reinforcement learning models can be deployed to test different UI configurations in real time, automatically converging on the most effective design based on user interactions.
Remember these points:
Start small with key features
Fix obvious problems first
Test changes carefully
Keep tracking after updates
Share insights with your team
Your goal isn't perfect design - it's making your product work better for real users.
And AI-driven heatmaps help you do exactly that.